Economics |
Empirical Finance |
Regression Analysis |
CAPM |
Time-Series Data |
Excel |
Economics | Empirical Finance | Regression Analysis | CAPM | Time-Series Data | Excel |
Testing Market Efficiency in the UK Equity Market
An empirical analysis of the FTSE 350, 1987–2006
Financial Economics
Royal Holloway, University of London

Research Question:
Does the UK equity market satisfy weak-form market efficiency?
Can looking at yesterday's market tell us anything about what happens tomorrow? According to Fama's (1970) Efficient Market Hypothesis, it shouldn't. If markets are weak-form efficient, information contained in past prices should already be reflected in today's price, making future returns difficult to predict from historical patterns alone.
To test this, I analysed almost 20 years of UK equity data examining seasonality, serial correlation and unusual periods of market activity for evidence of predictable patterns in returns.
Seasonality
Can returns be predicted by the time of year?
According to the EMH, returns should be unpredictable, with price movements following a random walk rather than a consistent pattern over time.
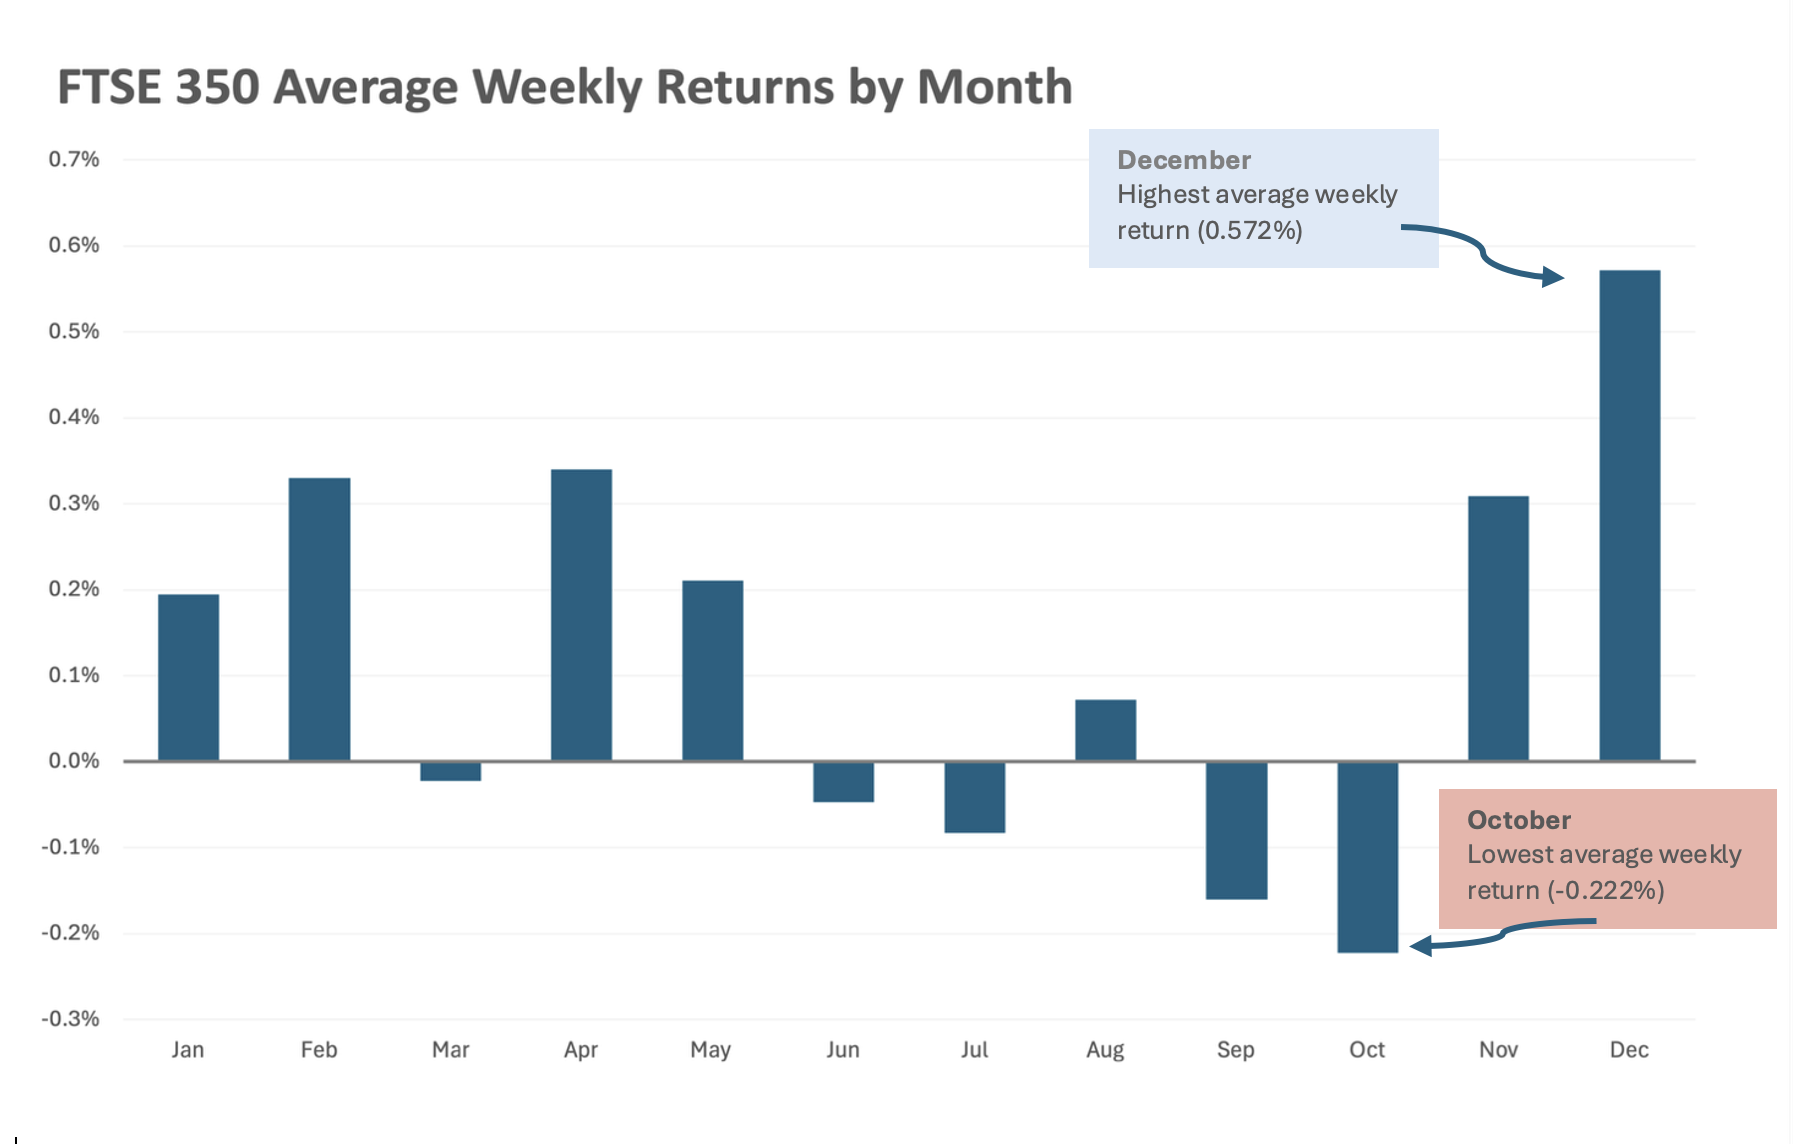
Returns showed a noticeable seasonal pattern.
I grouped weekly FTSE 350 returns by calendar month and compared average returns across the year. December recorded the highest average weekly return (0.57%), while October recorded the lowest (−0.22%).
This variation suggests that historical returns may contain some information about future performance, contrary to what strict weak-form efficiency would predict.
But a pattern alone does not prove market inefficiency.
For it to represent a genuine inefficiency, the pattern would need to be persistent and exploitable. If traders could systematically profit from it, arbitrage should eventually cause the opportunity to disappear.
Serial Correlation
Can last week's return help predict this week's?
I created a lagged return series and used regression analysis to test whether FTSE 350 returns were related to the previous week's performance.
Past returns had almost no relationship with future returns.
The relationship between current and previous-week FTSE 350 returns was very weak (0.0497) and statistically insignificant (p = 0.111). The regression explained less than 0.25% of the variation in weekly returns.
The evidence therefore suggests that past returns provided little predictive information about future returns, supporting weak-form market efficiency.
-
Almost no relationship between one week's return and the next.
-
The relationship was not statistically significant.
-
Past returns explained virtually none of the variation in current returns.
Bubble Detection
When did market behaviour become unusual?
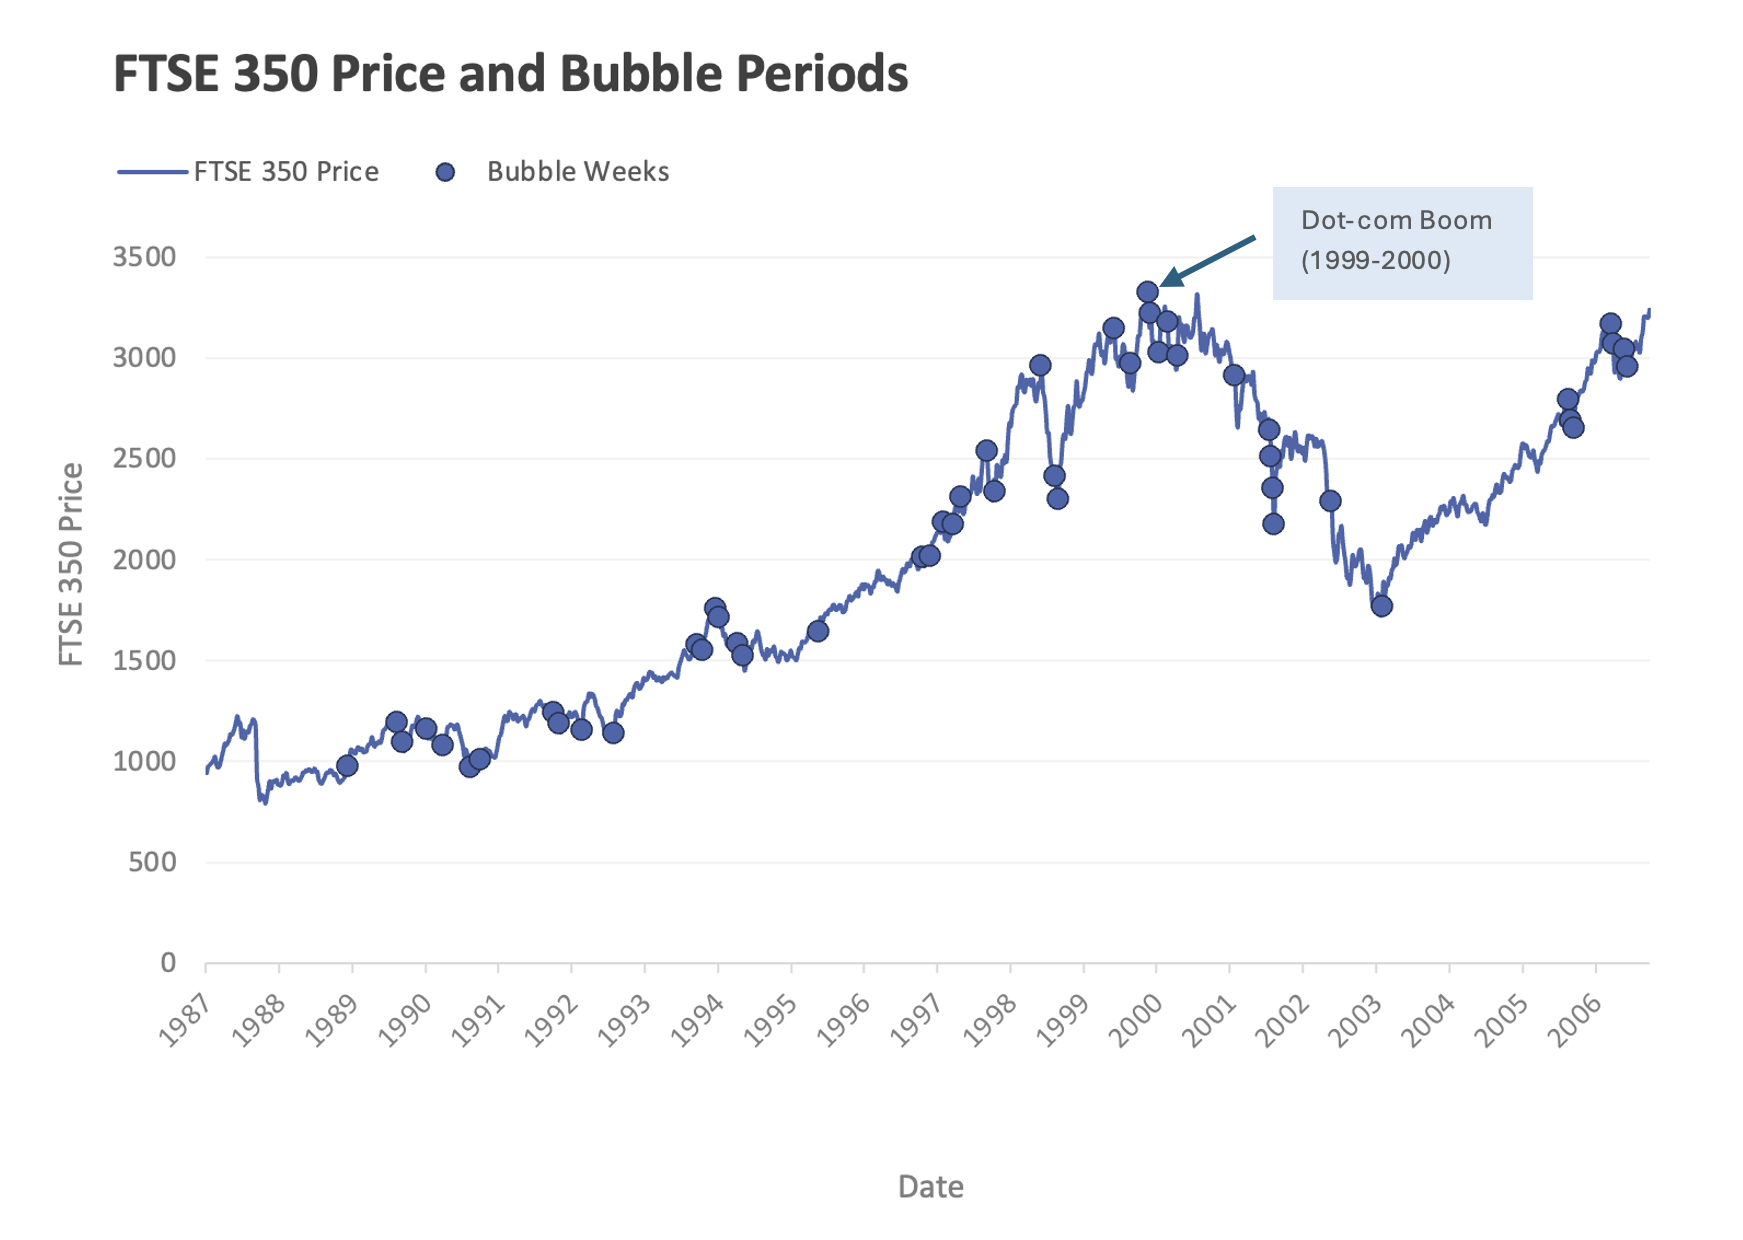
I built a rolling model using the previous 52 weeks of returns and volatility, flagging weeks where returns moved more than two standard deviations above their recent average. This allowed me to identify and visualise periods of unusually strong market activity.
Unusually large positive returns appeared in distinct clusters rather than being evenly spread over time.
The strongest concentrations appeared in the early 1990s, late 1990s and early 2000s. Notably, some of the strongest clustering coincided with the late-1990s technology boom and dot-com bubble period.
The model identified unusually large returns, rather than sustained overvaluation. The findings therefore suggest temporary departures from weak-form efficiency, rather than conclusive evidence of speculative bubbles.
Risk & Return — CAPM
Were returns explained by market risk?
I constructed an equally weighted portfolio of ten LSE-listed firms and compared its excess returns with the FTSE 350, using LIBOR as the risk-free rate. I then estimated CAPM to examine how much of the portfolio's performance could be explained by exposure to the wider market rather than abnormal returns.
Portfolio returns were strongly explained by exposure to the wider market.
The portfolio had a beta of 0.977, meaning it moved almost one-for-one with the market. Around 75.5% of variation in portfolio excess returns was explained by market excess returns, showing that market risk was the dominant driver of performance.
Ultimately the CAPM moves and generates returns consistent with EMH
Alpha was economically small and statistically insignificant (p = 0.791), suggesting no persistent abnormal return after accounting for market risk. This provides further evidence consistent with market efficiency.
-
The portfolio moved almost one-for-one with the market.
-
Most variation in portfolio returns was explained by the wider market.
-
No statistically significant evidence of abnormal risk-adjusted returns.
Conclusion
So, can yesterday's market tell us what happens tomorrow? Not reliably.
Across almost 20 years of UK equity data, I found little evidence that past returns could consistently predict future performance. Serial correlation and CAPM largely supported weak-form market efficiency, while seasonal patterns and clusters of unusual market activity pointed to temporary departures from efficiency.
Overall, the evidence suggests a market that was broadly efficient, but not perfectly so, with modest and episodic deviations during particular periods.
Want to explore the analysis in full?
Read the complete paper, including methodology, regression outputs and supporting calculations.